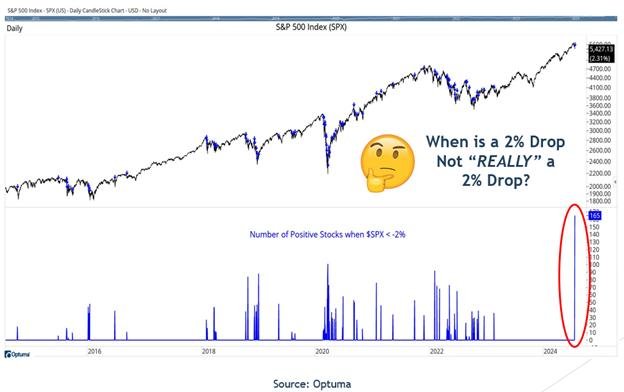
The S&P 500 experienced a significant 2% decline on July 24, marking the first such “down day” in 356 days. This drop resulted in the Magnificent Seven stocks losing around $700 billion in market capitalization and led to increased volatility in the market, causing some bears to emerge.
Despite the steep decline, there is a silver lining to be found in the market activity on that day. According to the MoneyShow Chart of the Week for July 29, 2024, data from Optuma revealed that 165 stocks actually closed higher on the day of the decline. This was the highest number of stocks to close higher during a 2% selloff day in at least a decade, with the last comparable instance occurring during the Covid low in March 2020.
Additionally, other indicators point to a more positive outlook for the market. While the market-cap-weighted S&P 500 ETF Trust (SPY) remained relatively flat in the 30 days leading up to the decline, the Invesco S&P 500 Equal Weight ETF (RSP) saw an increase of around 3.4% during the same period. The iShares Russell 2000 ETF (IWM) also experienced a significant uptick of over 12% during this time frame, indicating a rotation into small cap stocks.
The market rotation into small caps suggests a shift in investor sentiment and potential opportunities for growth in sectors such as financials, industrials, miners, and small caps. This rotation is seen as a positive development and is likely to continue, providing opportunities for investors to capitalize on new leaders in the market.
In light of these developments, the author maintains a constructive outlook on the market moving forward. The strong market rotation is viewed as a powerful and sustainable trend that investors should not resist but instead capitalize on by reallocating funds into emerging sectors and new market leaders. Ultimately, not every significant decline in the market should be interpreted as negative, as there are potential opportunities for growth and profit amidst market fluctuations.

